
Most MBA students meet Capsim the same way. In week three of a strategic management module, a login arrives by email, and the brief sounds almost casual: run a company for eight years against five rival teams. Then the first Capstone Courier lands, the proformas refuse to balance, and the group chat goes quiet for two days.
The simulation is hard for a specific reason. Every decision touches every other decision, and your position each round is the product of your own accumulated choices inside a market the other teams keep moving. Nothing is static, and a good plan expires the moment a competitor acts.
This guide maps the full toolset, with the numbers behind each one.
Who actually uses Capsim, and where it sits in a programme
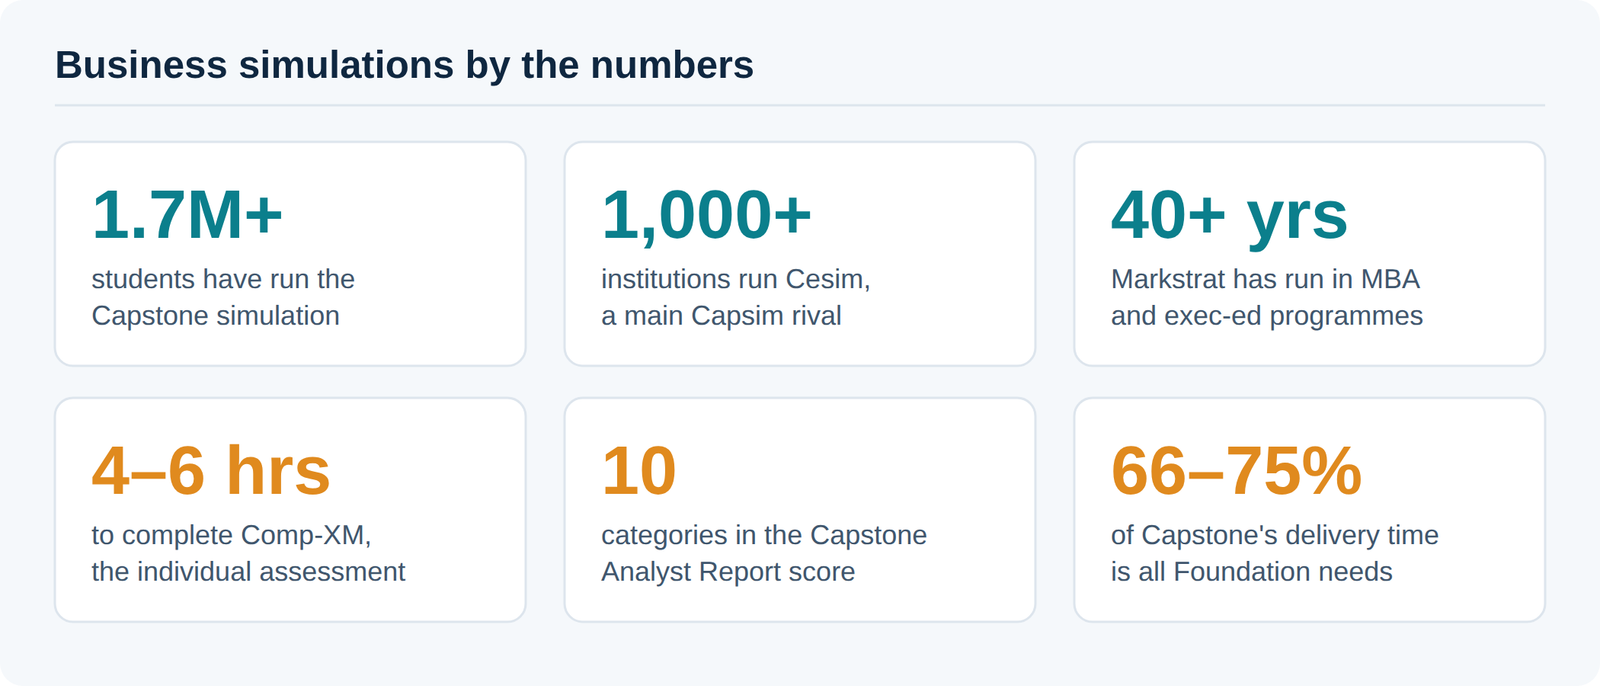
Capsim started in executive education and moved into degree programmes. Today it runs in three quite different contexts, and knowing which one you are in tells you how deep the marking will go.
In degree programmes it sits in the wrap-up course, usually strategic management or a business capstone, because it pulls the whole spectrum of business education together. To beat rival teams you have to integrate functional strategies into one coherent position, which is exactly what a capstone module is supposed to test. In corporate seminars it runs as a compressed exercise for managers. In interdisciplinary programmes, it teaches business vocabulary to engineers, lawyers, and medical professionals who never took a finance module.
1. The Capsim simulations themselves
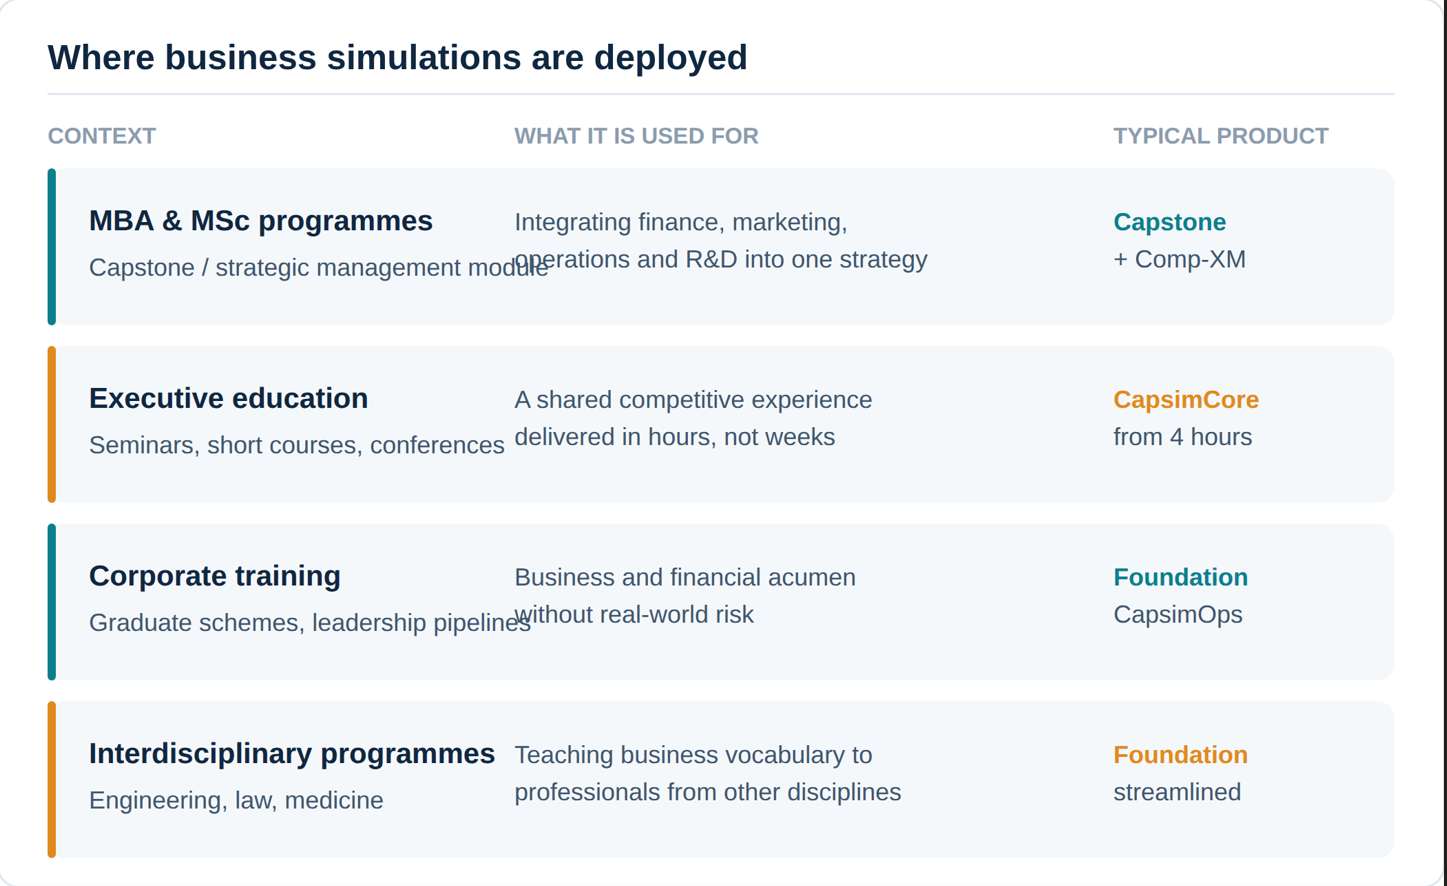
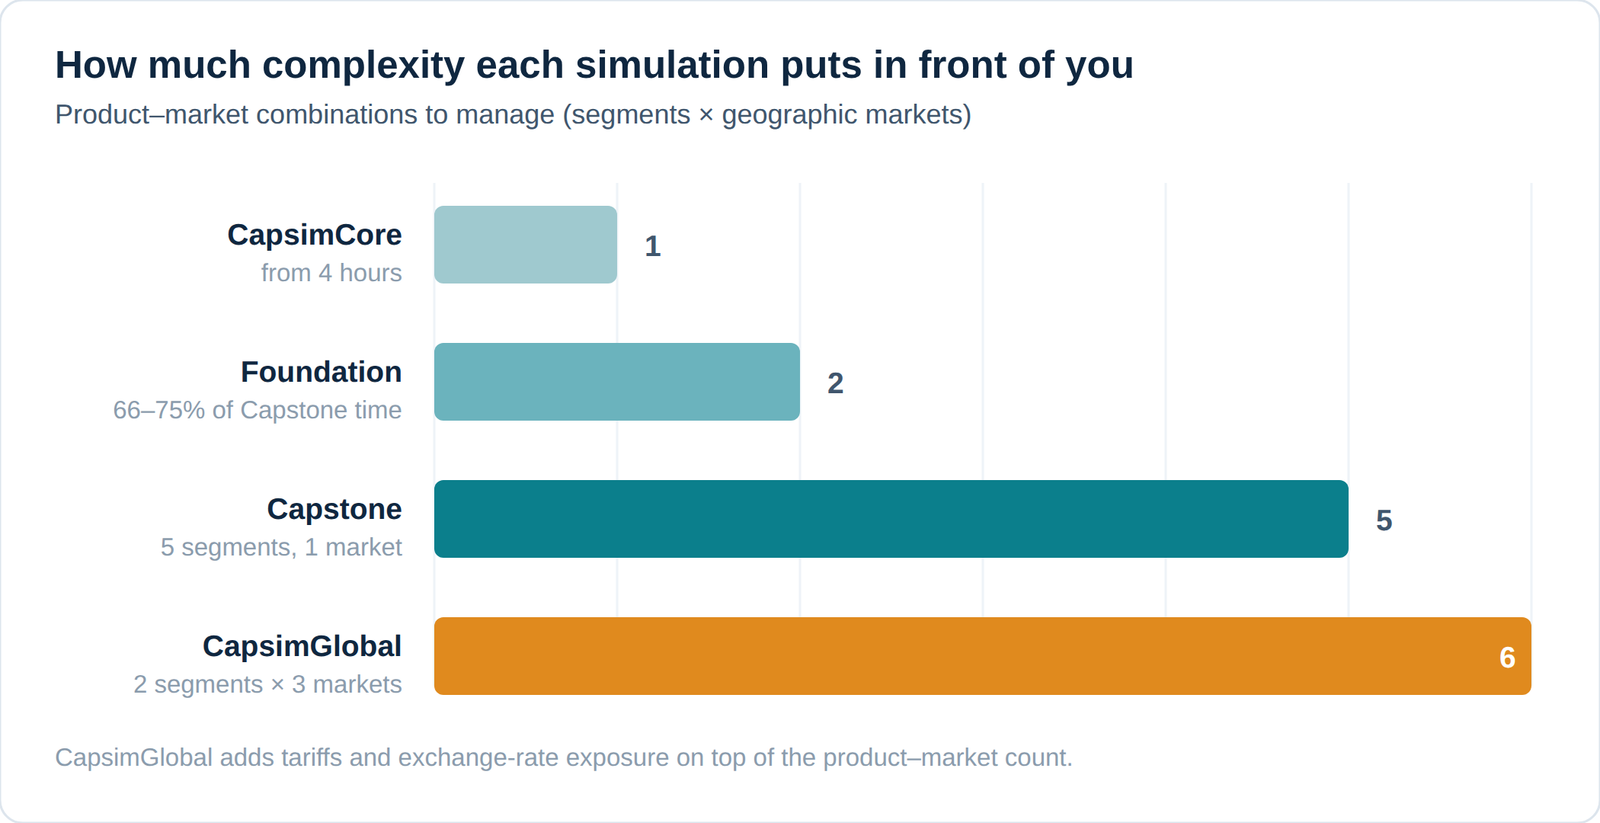
Capstone is the one most people mean when they say Capsim. It is the best-selling product in the range, with more than 1.7 million students behind it, and it covers five market segments across six or eight rounds. If your report lists Traditional, Low End, High End, Performance and Size, you are on Capstone.
Capstone 2.0 is the updated build. Same fundamentals, different interface, plus an integrated sustainability module where teams weigh profit against environmental impact. Check your version before downloading anyone’s walkthrough, because older guides assume the original layout.
Foundation runs two segments and one product instead of five, with TQM and HR as its cross-functional modules. Stripped of extras it can be delivered in roughly two-thirds to three-quarters of the time Capstone needs.
CapsimCore simplifies Foundation further and can run in as little as four hours, which is why it appears in executive education and compressed online terms rather than full semesters.
CapsimGlobal and GlobalDNA take the same framework international. They swap five domestic segments for two segments across three geographic markets, and add pricing and financial problems that do not exist in Capstone at all, including tariffs and exchange rates.
|
Simulation |
Segments | Markets | Cross-functional modules | Typical use |
|
CapsimCore |
Simplified |
Domestic |
None |
Exec ed, orientation, 4-hour sessions |
|
Foundation |
2 (1 product) |
Domestic | TQM, HR |
Undergrad, short MBA modules |
|
Capstone |
5 |
Domestic | TQM, HR, Sustainability, Advanced Marketing |
MBA capstone, full semester |
|
CapsimGlobal |
2 |
3 geographic | None |
International business pathways |
| CapsimOps | Ops-focused |
Domestic |
Operations |
Operations management courses |
2. The assessments that follow the simulation
Comp-XM is the part students underestimate. You re-run the simulation alone, then answer board-level questions that require analysing your competitors’ annual reports, not just your own, scored against the Big 7 learning goals over roughly four to six hours. A team can carry a quiet member through Capstone. Comp-XM is designed so that it cannot.
CapsimInbox-XM is the faster alternative. Instead of re-running anything, you interpret your own company’s results through a board-meeting inbox covering marketing, finance and operations. It is scored against an expert key set by subject-matter experts, not generated by AI.
TeamMATE aggregates structured peer and self-ratings on how the group worked together, which matters when your module marks team process rather than only results.
3. The analysis tools already sitting in your account
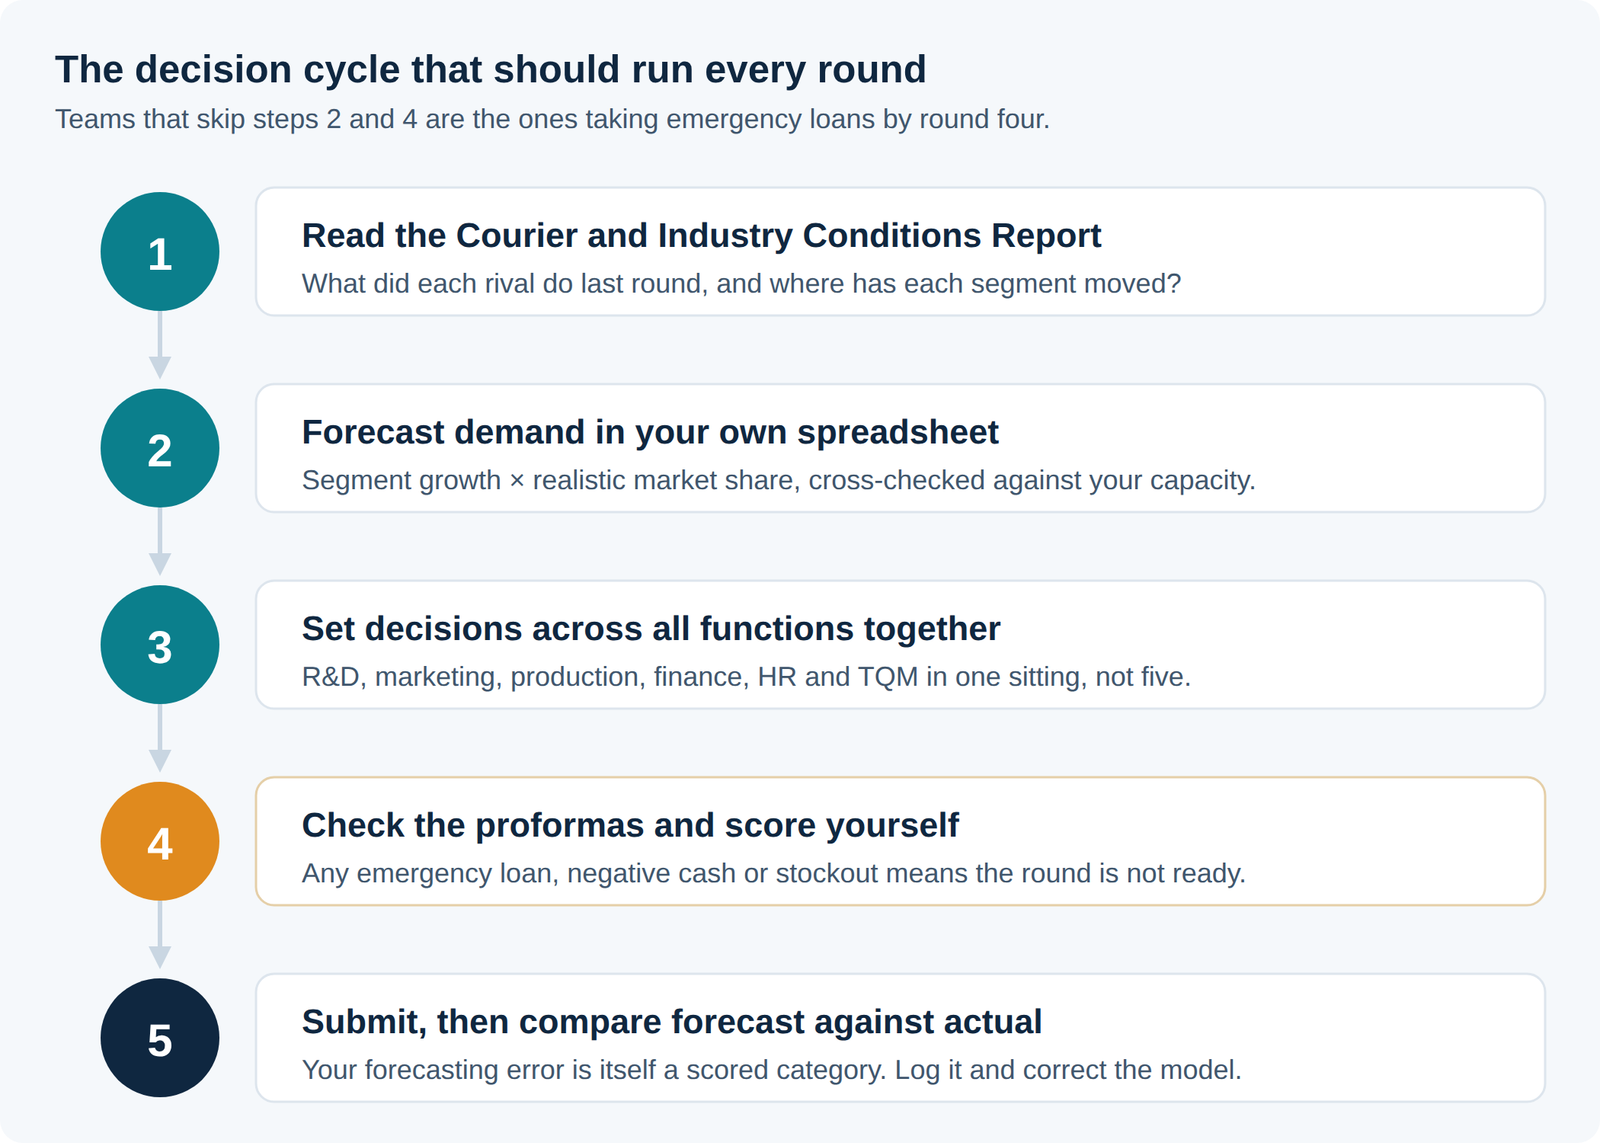
The Capstone Courier is the most valuable document in the simulation, and the one students skim. It shows the decisions your competitors made in the previous round, which is the only competitive intelligence you get. Download and keep every issue. One Courier tells you what happened. Six Couriers tell you what each rival is trying to do.
The Industry Conditions Report holds segment drift and buying criteria. Customers move each year, and their weighting of price, age, reliability and positioning moves with them. Teams that lose usually built an excellent product for last year’s customer. Where margin is concerned, the profit margin calculator and contribution margin calculator show which cost line is responsible.
Proformas are your projected income statement, balance sheet and cash flow, generated before you commit. Treat them as a veto. If the proforma shows an emergency loan, the round is not finished, however much the team wants to go to bed. The emergency loan estimator projects your closing cash and ranks the cheapest ways to close a shortfall before you commit.
You can download the Capsim Excel decision application from the platform. It lets you enter decisions offline, save them to your own machine, then review the proformas, Balanced Scorecard and annual report before submitting. The real gain is that Excel lets you hold three versions of a round side by side. The browser does not. Our free Capsim calculators cover the same ground without a download.
4. The spreadsheets you build yourself
This is where teams separate. Capsim gives you the data. It does not give you a model.
A demand forecasting model
Forecasting is where most groups lose, because an optimistic number creates inventory nobody buys and a cautious number creates stockouts and an emergency loan. A sheet that projects segment growth, applies a realistic market share and cross-checks against capacity will beat instinct in every single round — or use our Capsim sales forecast calculator, which builds the number from segment demand, survey score, awareness and accessibility and converts it into a production quantity. For pricing, promotion and sales budgets that actually move your survey score work with a Capsim marketing analyst.
An R&D timing and perceptual map tracker
Products drift out of position as segments move, and R&D projects take real time to complete. Track where each product sits now, where its segment will be next year, and when revisions actually land. Otherwise, you launch an upgrade six months after customers stopped wanting it. The R&D revision date calculator aims your revision at where the segment will be, not where it sits today.
A capacity, automation and cash-flow planner
Automation cuts labour cost but slows repositioning. Capacity is expensive and slow to add. Long-term debt raised in rounds one to three funds the position you want in rounds four to eight. Model these together, or you will discover in round five that you cannot fund payroll. The automation payback calculator and the capacity vs second shift calculator handle the two halves of that decision. A Capsim operations expert can help you plan capacity and automation across all eight rounds, not just the next one.
An Analyst Report self-scoring sheet
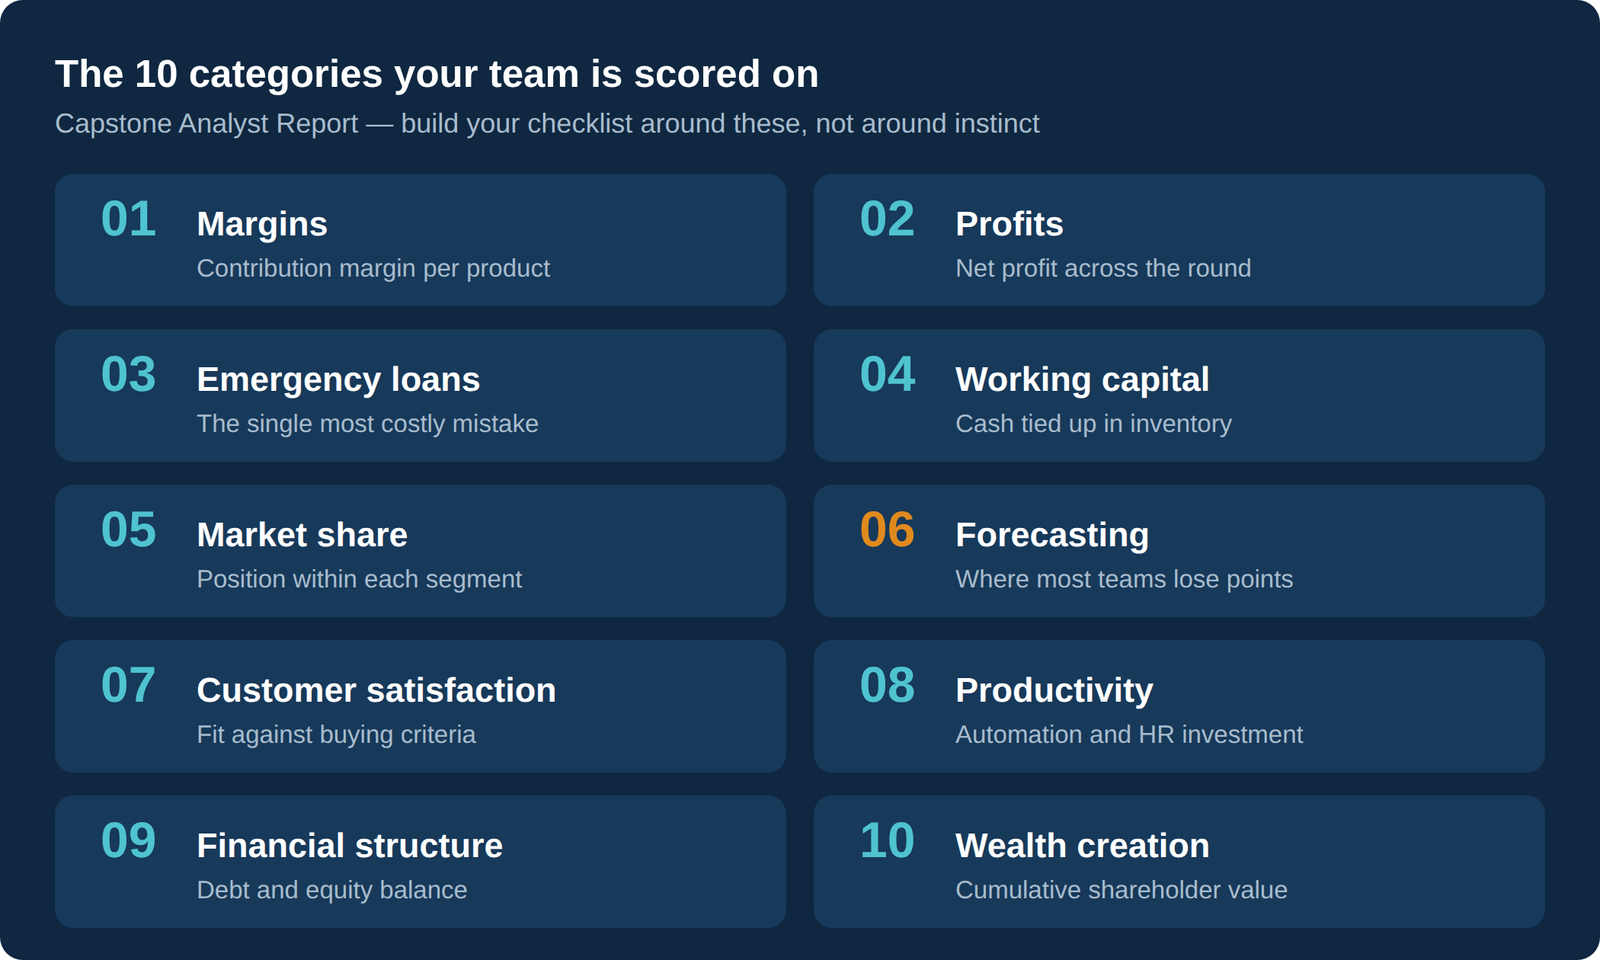
Score your proposed round the way the simulation will, before you submit it. If the balance sheet still will not balance, a Capsim finance expert can walk through your stock, bond and cash decisions line by line.The Capstone Analyst Report evaluates management performance across ten categories. Ten minutes with this checklist catches more errors than another hour of debate. The Balanced Scorecard calculator does it across all eighteen scored metrics and ranks your biggest point losses.
5. The simulations your course might use instead
Module handbooks often name one of these while students still search for Capsim. The mechanics transfer; the specifics do not.
| Platform | Focus | Best known for | Where it runs |
| Markstrat (StratX) | Marketing strategy | Brand portfolios, segmentation and positioning over 40+ years of use | INSEAD, Wharton, exec ed |
| Cesim | Multidisciplinary | Web-based and multilingual; broad rather than deep | 1,000+ institutions worldwide |
| Business Strategy Game | Strategy | Instructor tools and grading integration for full semesters | US and UK undergrad / MBA |
| GLO-BUS | Product design | Configuring products and competing on price and features | Strategy modules |
| Marketplace Live | Customer-driven | Segmentation, branding and product launch | Marketing and entrepreneurship |
| Forio | Custom modelling | The engine behind a number of Harvard and Wharton simulations | Top-tier MBA cases |
| The Fresh Connection | Supply chain | Short rounds with an operations focus | SCM modules |
Where teams actually lose, based on what we see
The pattern repeats every intake. Teams lose rounds one and two learning the interface, then spend the remaining six recovering rather than competing. By the time the model makes sense, three simulated years have already gone.
Three failures account for most of it. Forecasting on optimism rather than on segment data. Changing strategy in round four because round three went badly, without understanding why. And leaving finance to one person who submits without the rest of the team seeing the proforma.
Stuck on a round? Talk to a tutor who has taught it.
PrestoExperts works with MBA and MSc students across UK and US universities on simulation mechanics, forecasting models, financial statement analysis, Comp-XM preparation and the written strategy report that usually accompanies the module. Choose a specialist: our top-rated Capsim expert for full-simulation strategy, Capsim Finance Pro for cash flow and financing, Capsim Marketing Analyst for pricing and positioning, Capsim Operations Expert for capacity and automation, or CompXM Coach for exam preparation. One-to-one, in your timezone, with a free 20-minute trial session.